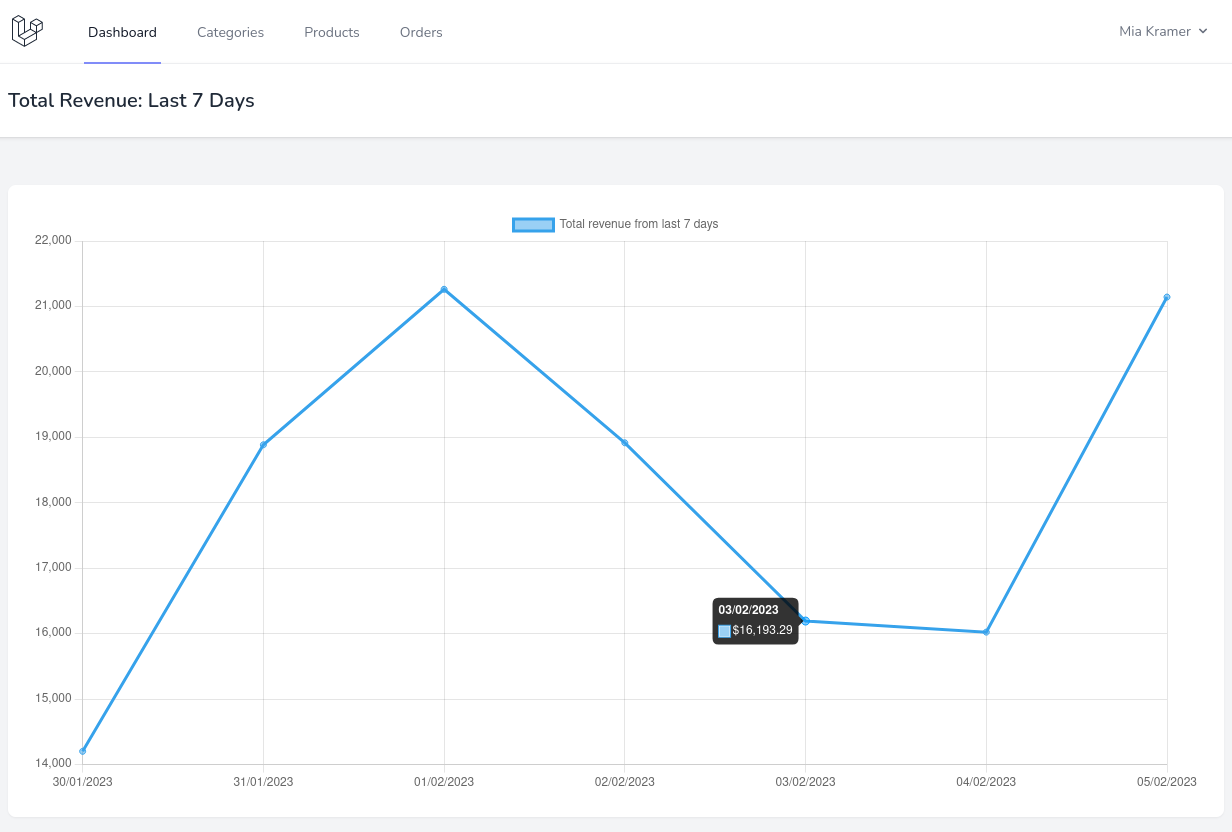
In this last lesson of this course, we will make a last 7 days total revenue chart using Chart.js and Livewire Polling feature.

We'll start by adding Chart.js from CDN.
resources/views/layouts/app.blade.php:
<script src="https://code.jquery.com/jquery-3.5.1.min.js"></script><script src="https://cdn.jsdelivr.net/npm/select2@4.1.0-rc.0/dist/js/select2.min.js"></script>@livewireScripts<script src="https://cdn.jsdelivr.net/npm/chart.js"></script> <script src="https://unpkg.com/@nextapps-be/livewire-sortablejs@0.2.0/dist/livewire-sortable.js"></script><script src="//cdn.jsdelivr.net/npm/sweetalert2@11"></script>Next, of course, we need to create the Livewire component and add it to the dashboard.
php artisan make:livewire TotalRevenueChartresources/views/dashboard.blade.php:
<x-app-layout> <x-slot name="header"> <h2 class="font-semibold text-xl text-gray-800 dark:text-gray-200 leading-tight"> {{ __('Dashboard') }} {{ __('Total Revenue: Last 7 Days') }} </h2> </x-slot> <div class="py-12"> <div class="max-w-7xl mx-auto sm:px-6 lg:px-8"> <div class="bg-white dark:bg-gray-800 overflow-hidden shadow-sm sm:rounded-lg"> <div class="p-6 text-gray-900 dark:text-gray-100"> {{ __("You're logged in!") }} @livewire('total-revenue-chart') </div> </div> </div> </div></x-app-layout>For showing the chart, we will use Livewire in combination with Alpine.js. First, in the component, we will add the getData() method in which we will make a query to DB and later will return the prepared array to use in the chart.
app/Http/Livewire/TotalRevenueChart.php:
class TotalRevenueChart extends Component{ // ... protected function getData(): array { $data = Order::query() ->select('order_date', \DB::raw('sum(total) as total')) ->where('order_date', '>=', now()->subDays(7)) ->groupBy('order_date') ->get(); return [ 'datasets' => [ [ 'label' => 'Total revenue from last 7 days', 'data' => $data->map(fn (Order $order) => $order->total / 100), ] ], 'labels' => $data->map(fn (Order $order) => $order->order_date->format('d/m/Y')), ]; }}This will return a result similar to this:
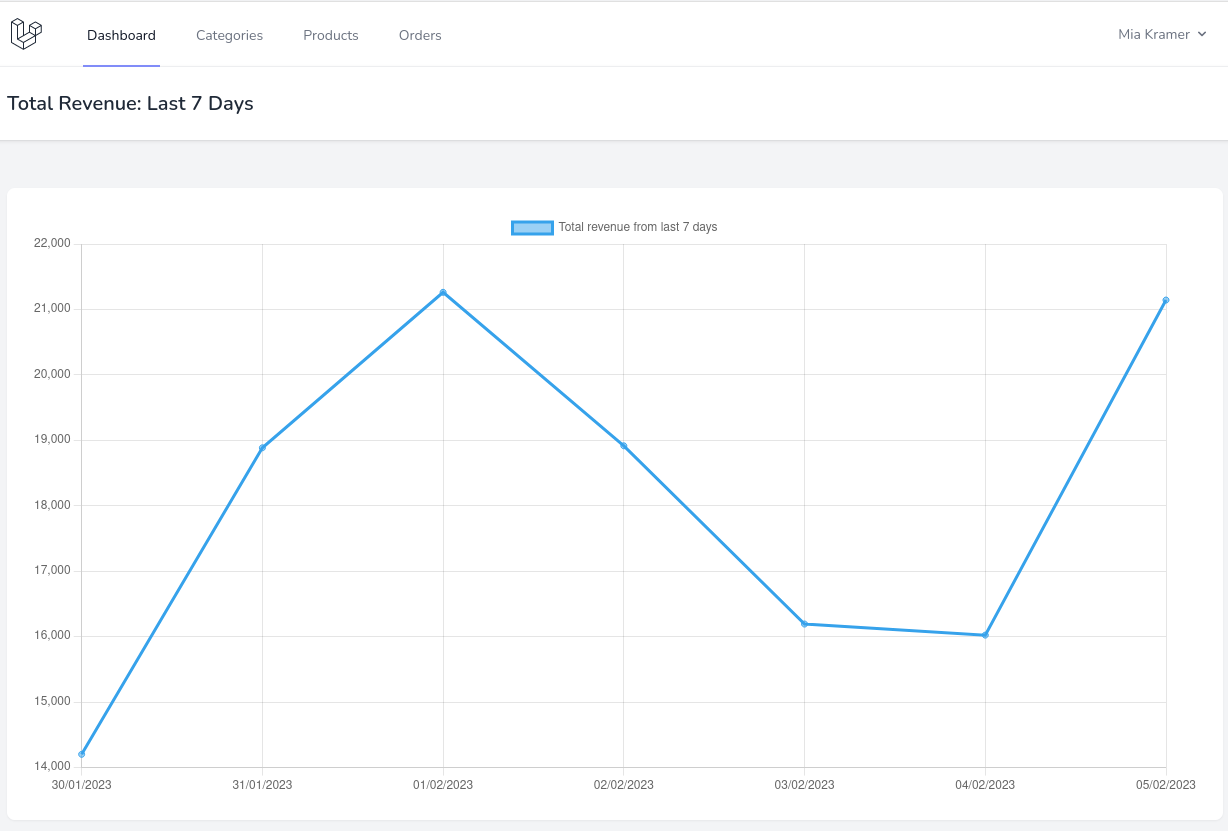
array:2 [▼ // app/Http/Livewire/TotalRevenueChart.php:18 "datasets" => array:1 [▶] "labels" => Illuminate\Support\Collection {#1503 ▼ #items: array:7 [▼ 0 => "30/01/2023" 1 => "31/01/2023" 2 => "01/02/2023" 3 => "02/02/2023" 4 => "03/02/2023" 5 => "04/02/2023" 6 => "05/02/2023" ] #escapeWhenCastingToString: false }]Now we can show the chart. In Alpine everything starts with the x-data directive, so we will add all the code to it.
resources/views/livewire/total-revenue-chart.blade.php:
<div> <canvas x-data="{ chart: null, init: function () { let chart = new Chart($el, { type: 'line', data: @js($this->getData()), }) } }" style="height: 320px;"> </canvas></div>Our chart now should show some data:

Now we can add functionality to auto-refresh the chart every 1-minute using Livewire polling. With wire:poll we will call the updateChartData() method in which we will fire an event called updateChartData with the newly fetched data from DB. Then this event will be caught by Alpine.js which will update the chart. The very important here is to add wire:ignore to the canvas element so that Livewire would ignore DOM changes.
app/Livewire/TotalRevenueChart.php:
class TotalRevenueChart extends Component{ // ... public function updateChartData(): void { $this->dispatch('updateChartData', data: $this->getData())->self(); } // ...}resources/views/livewire/total-revenue-chart.blade.php:
<div wire:poll.60s="updateChartData"> <canvas x-data="{ chart: null, init: function () { let chart = new Chart($el, { type: 'line', data: @js($this->getData()) }) $wire.on('updateChartData', async ({ data }) => { chart.data = data chart.update('resize') }) } }" style="height: 320px;" wire:ignore> </canvas></div>If you would add a new order, the chart now should update automatically. Last thing here, we will make a change to the tooltip. When hovered we will only show the value and dollar sign before it.
resources/views/livewire/total-revenue-chart.blade.php:
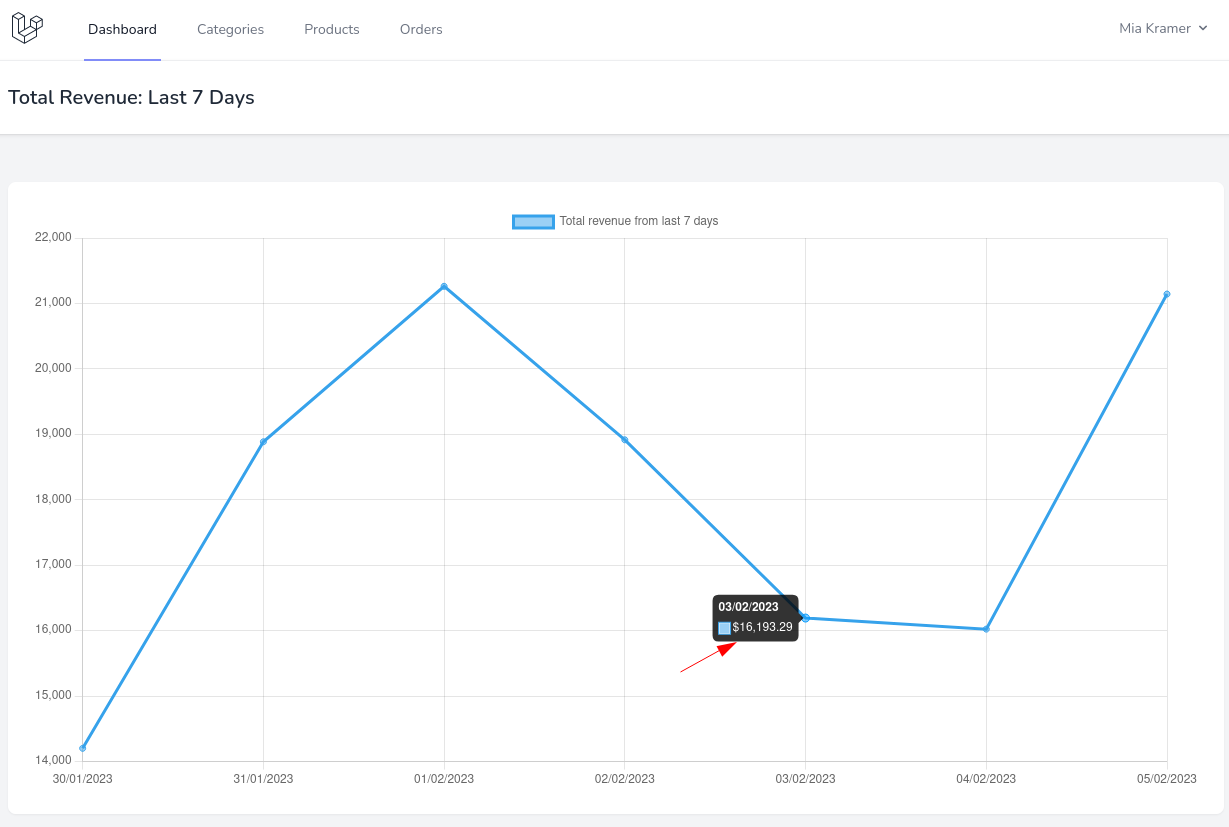
<div wire:poll.60s="updateChartData"> <canvas x-data="{ chart: null, init: function () { let chart = new Chart($el, { type: 'line', data: @js($this->getData()), options: { plugins: { tooltip: { callbacks: { label: function (context) { return '$' + context.formattedValue } } } } } }) $wire.on('updateChartData', async ({ data }) => { chart.data = data chart.update('resize') }) } }" style="height: 320px;" wire:ignore> </canvas></div>
And that's it for this course! The repository is available here on GitHub.